The Beginner’s Guide: Japanese Candlestick Pattern

Have you ever wondered how to predict the movement of cryptocurrencies? Most professional traders use charts and analysis. The good news is, the process is not as difficult as you might think! In fact, with the right tools and understanding, even novice traders can harness the power of chart analysis.
According to an article published by Consumer News and Business Channel (CNBC), 88% of the predictions based on the quantitative analysis turned out accurate. Funny enough, the selected methods weren’t that advanced - just so any average or even a beginner trader could master them.
The fact is, in the world of cryptocurrency trading, it is important to read charts and analyze price patterns. This is one of the most used processes used by traders to analyze the market and make more accurate predictions on the value of a digital asset. The predictions, when done correctly, can lead to significant profits.
With the right analysis of past trends and a few confirmations from indicators such as MACD (Moving Average Convergence Divergence) or RSI (Relative Strength Index), an investor can make entry decisions with above 65% level-of-accuracy.
The best part? You don't need to know it all; you can make the most of your investment by leveraging your knowledge on the most powerful Japanese candlestick pattern in this post to understand market dynamics better. By focusing on the key patterns and what they indicate, even novice traders can start to make informed decisions.
The ABCs of Candlestick
Candlestick charts can be useful for beginners who have trouble reading a regular bar chart. In addition, candles provide an easy way to identify trends in the market. They visually represent the opening, closing, high, and low prices for a specific time period, making it easier to interpret market behavior.
So far, they are one of the most common technical tools used for price analysis. This has been used since traders and investors started looking for patterns that may predict where a currency or commodity will go next centuries ago! The history of candlestick charts dates back to 18th century Japan, where they were used for rice commerce.
Now this charting technique is used for technical analysis of the financial markets and the crypto space.
At the heart of the Japanese candle is its mechanism, which provides a comprehensive representation of market price movements within a chosen time frame. Each candle is composed of four main components: the opening price, the closing price, the highest price, and the lowest price during that period. The central rectangular part, known as the body, changes color based on market behavior. A green or white body indicates that the closing price was higher than the opening, signaling a bullish period. In contrast, a red or black body suggests the opening price surpassed the closing price, marking a bearish period. Extending from the body are lines termed as wicks or shadows. These wicks capture the highest and lowest prices of the period, with the top of the upper wick showcasing the peak price and the bottom of the lower wick revealing the lowest. Gridlines often aid in visualizing these price levels more clearly.
When constructing charts, traders select a specific time frame for each candle, such as 1 minute, 1 hour, or 1 day. For instance, in a daily chart, each candle encapsulates the price movement of one entire day. The combination of the candle's body color, size, and the length of its wicks offers a snapshot of market sentiment during that time. Major gridlines can further enhance the clarity of these charts by demarcating significant price levels or time intervals. Furthermore, while individual candles shed light on the price action of a single time frame, patterns formed by a series of them can be even more informative. These patterns, like the “bullish engulfing” which involves a small red price bar overtaken by a larger green one, can hint at potential trend reversals or continuations. Major gridlines can also assist in identifying these patterns by providing a clearer visual context.
In essence, Japanese candlestick charts serve as a potent tool in a trader's arsenal. They not only provide a visual representation of market sentiment but also hint at potential future price trajectories. By grasping the fundamentals of the price bar construction and recognizing the significance of various patterns, traders can make smarter decisions.
How to Master Japanese Candlesticks
Candlestick charts can be a useful way to look at the market structure and potential opportunities. However, they instead offer insight into price actions and directions of the market trend based on patterns! Each price bar represents a specific time frame, and its shape and color provide information about the market's sentiment during that time frame.
There are many types of candlesticks; some signify a potential reversal or a trend continuity. All there is for trader is, identifying areas on charts that might signal what direction the market may take and when a trading opportunity presents itself!
The following tips can help you get started:
- Understanding the basics. Before diving deep into specific patterns, it's crucial to understand the basic components of a price bar. Its body represents the range between the opening and closing prices, while the wicks or shadows show the highest and lowest prices during that period. A green or white body indicates a price increase, while a red or black body indicates a decrease.
- Time frames and analysis. While each candle represents a specific time frame, the choice of time frame can significantly impact the analysis. For day traders, shorter time frames like 1-minute or 15-minute charts might be more relevant. In contrast, long-term investors might focus on daily or weekly charts. The patterns remain consistent across different time frames, but their significance can vary.
- Volume. One aspect often overlooked when analyzing candlestick patterns is volume. Volume refers to the number of shares or contracts traded in a security or market. A candlestick pattern accompanied by high volume is generally considered more significant and reliable than the same pattern with low volume. For instance, a bullish engulfing pattern with above-average volume might indicate a strong buying interest and a potential trend reversal.
- Confirmation is key. While candlestick patterns provide valuable insights, they shouldn't be used in isolation. It's essential to wait for confirmation before making a decision. For example, after spotting a potential bullish reversal pattern, traders might wait for a subsequent green candle or a positive indicator signal before entering a long position.
- Limitations and pitfalls. Like all technical analysis tools, candlestick patterns have their limitations. They provide insights based on past price data but cannot predict future price movements with absolute certainty. Traders should be aware of potential false signals and always use stop-loss orders to manage their risk.
The world of Japanese candlesticks is vast, with over 40 recognized patterns. To truly master them, continuous learning and practice are essential. Many online platforms offer virtual trading accounts, allowing traders to practice their skills without risking real money.
This multi-faceted approach increases the probability of making accurate decisions. Delving deeper, let's explore the major candlestick patterns.
Bullish Reversal Patterns
Hammer
The Hammer pattern is a bullish reversal pattern where buyers push prices back up after a prolonged downtrend. It resembles a hammer with a short body and a long lower shadow, indicating that the market rejected lower values. It's formed when the market goes down sharply before going back up again with an opening at or near its previous lows.
A long lower wick at the bottom of a downtrend indicates that, despite high selling pressure from previous candlestick days, bulls managed to push up against sellers.
Green candles indicate stronger reactions from bull camp, which could mean more potential gains are coming your way if you hold to an uptrend. Recognizing this pattern early can provide traders with a lucrative buying opportunity.

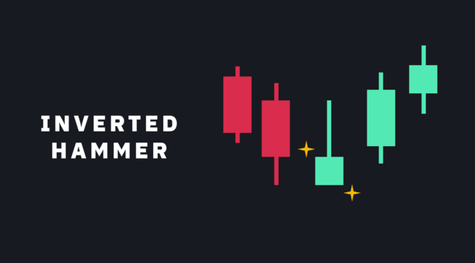
Inverted Hammer
The name says it all: this pattern has similarities to a hammer but with an extra wick above the body. This pattern often appears at the bottom of a downtrend and signals a potential bullish reversal.
An inverted hammer occurs when prices stop falling or reversing after being pushed lower than their opening level by buyers who eventually control market action. However, this lucky turn may come with a sharp reversal of upward momentum before long.
This time, the upper tip of the candle should be at least twice as long and wide compared to its lower body, signifying that the market has reached its lowest point - which often suggests a reversal. For this pattern to be confirmed, it's crucial to see a green candle in the following trading session.
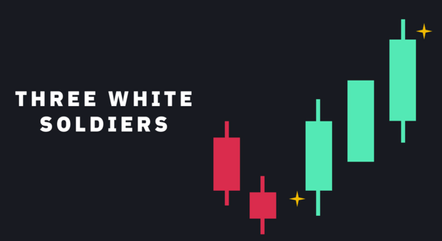
Three White Soldiers
The three white soldiers' pattern is an old and reliable indicator of a market trending up or down. It consists of three consecutive long green candlesticks that open within the previous candle's range and close higher. The candle closed at or above the previous session high, with long wicks indicating continuous buying pressure from sellers trying to lower prices.
It should be noted, however, if there are short lower candles on either side, it could mean selling pressure will eventually win out over this trend as well (or vice versa).
This bullish signals continuation signal consists of three consecutive three green candles that open within the previous candle's body and close at or above its high price level, with long lower wicks indicating buying pressure strong enough to push up prices further into their next cycle.
The size/lengths of these candles can be used as indicators for how likely they are to continue in this direction - short-wicked implies there may not be continuous demand pushing the market higher.
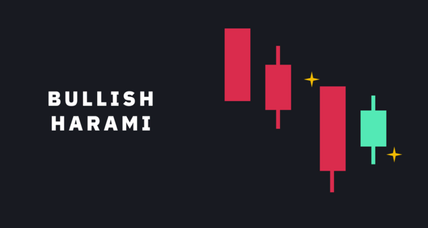
Bullish Harami
A bullish harami is a long red candle followed by smaller green candles that are entirely contained within the body of the previous ones. The word "harami" in Japanese means "pregnant," and this pattern resembles a pregnant woman, with the second candle being the "baby." The pattern can unfold over two or more days, and it suggests there might be selling momentum slowing down but not stopping altogether since sellers are still in control - meaning they could make an appearance again soon!
A bullish harami can be seen as an indicator that selling momentum may slow down and come to an end in the markets! This pattern often indicates a potential reversal in the market, especially when accompanied by high trading volume on the second day. It's a sign that the bears are losing control and the bulls are starting to step in. However, traders often wait for further confirmation, such as a green candle on the following day, before making a buying decision.
Bearish Reversal Patterns
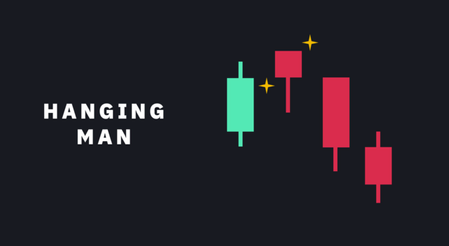
Hanging man
The Hanging Man is the bearish counterpart to a hammer. It typically forms at the end of an uptrend with a small body and long lower wick, indicating that there was once a large sell-off, but bulls managed to take back control, pushing prices higher into capitulation territory.
This bearish pattern suggests that sellers are starting to enter the market and the buyers might be losing their grip. It can act as a warning for potential buyers before bears gain momentum again. This can be interpreted as both warning signs for upcoming market movements, or serves as confirmation that bulls are still in control. However, like all candlestick patterns, it's essential to wait for further confirmation before acting on the Hanging Man pattern.
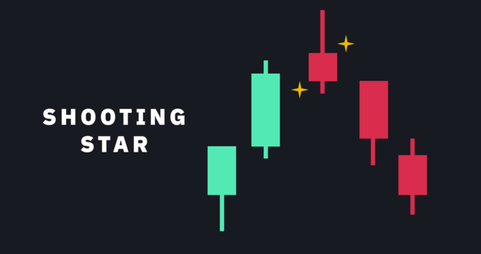
Shooting Star
The Shooting Star pattern is another common bearish reversal signal. It looks like an inverted hammer but appears after an uptrend. The shooting star is a pattern that indicates when traders expect the price of an asset to go up and then fall back down again.
The name comes from how they look like shooting stars as seen in their upward trajectory during an uptrend—only make one higher before a reversal direction with little or no warning sign beforehand. The long upper shadow indicates that the buyers drove values up during the session, but by the close, sellers had pushed the price back down to near the opening price. Therefore, it's best to wait for a few more candles to clarify the market trend rather than decide based on this pattern.
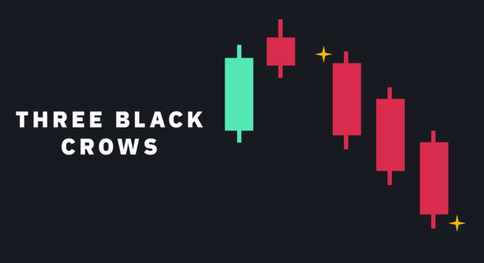
Three Black Crows
The Three Black Crows is a bearish reversal pattern that consists of three consecutive long red candles. These candles open within the previous candle's body and close lower than the previous candle, indicating strong selling pressure. The bearish equivalent of three white soldiers, these candles should have long higher wicks, indicating continuous selling pressure driving the price down and not an indication that buyers are coming in at any point soon!
The size and length of these candles can also give you clues about continuation chances: if they're small, then there's less chance we'll see the market continue its downtrend. This pattern is a strong indication that the uptrend may be over and a new downtrend is starting.
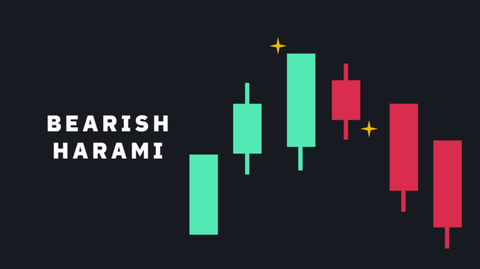
Bearish Harami
A bearish harami is characterized by a prominent green candle, representing a continuation of the prevailing bullish trend, immediately followed by a contrasting small red candle. This unique formation typically emerges at the culmination of an uptrend. The presence of the smaller red candle nestled within the body of the preceding green candle serves as a visual cue, hinting at a potential decrease in buying pressure. Such a shift can be particularly significant in markets like cryptocurrency, which are known for their volatility.
The appearance of the bearish harami often raises caution among traders, suggesting that the momentum driving the uptrend might be waning. This potential exhaustion of bullish momentum can sometimes herald further downside movement in the price of assets, whether they be cryptocurrencies or other financial instruments. In essence, the bearish harami acts as a sentinel, warning of a possible trend reversal. It underscores the ever-evolving dynamics of market sentiment, emphasizing the need for traders to remain vigilant and adaptive.
As with all technical patterns, it's crucial to consider the bearish harami in conjunction with other indicators and market data to make informed decisions. While the pattern itself is a strong indicator of a sentiment shift, corroborating it with other signals can enhance its predictive accuracy.
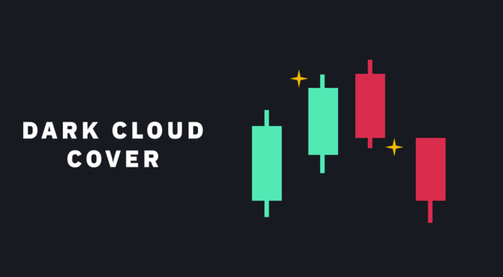
Dark Cloud Cover
The Dark Cloud Cover pattern is a two-candle bearish reversal pattern. It starts with a strong green candle, followed by a red candle that opens above the previous green candle's high but closes below its midpoint. This indicates that after a strong uptrend, the bears have started to step in, and the sentiment might be changing. The deeper the red candle penetrates the green, the more reliable the reversal signal. It's a sign that the bulls are losing control and the bears are taking over.
Continuation Patterns
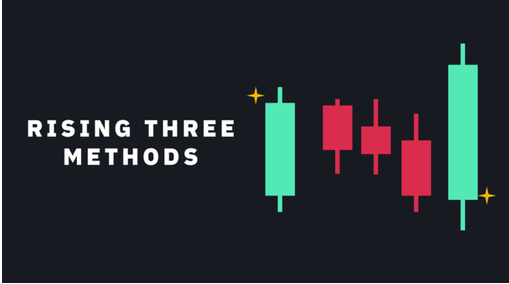
Rising Three Methods
The Rising Three Methods is a bullish continuation pattern, often seen during a pronounced uptrend. It begins with a prominent long green candle, signifying strong buying pressure. This is then followed by three small red candles, which can be viewed as a period of consolidation or slight retracement. These red candles do not erase the gains of the initial green candle, indicating that sellers haven't taken control.
The pattern culminates with another long green candle, reinforcing the initial bullish sentiment. This sequence suggests that after a brief pause or consolidation, the uptrend is not only likely to continue but might do so with renewed vigor. It's a compelling indication that the current uptrend is robust, and that buyers are firmly in the driver's seat.
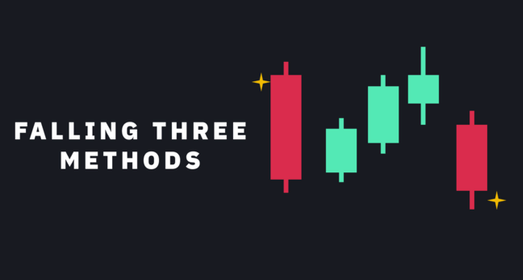
Falling Three Method
Conversely, the Falling Three Methods serves as the bearish counterpart to the Rising Three Methods and is typically observed during a clear downtrend. It initiates with a pronounced long red candle, indicating strong selling pressure. This is followed by three small green candles, suggesting a minor upward retracement or consolidation.
However, these green candles don't surpass the losses of the initial red candle, showing that buyers aren't in control. The pattern concludes with another long red candle, echoing the initial bearish sentiment. This formation indicates that after a short-lived pause, the downtrend is set to persist. It's a clear sign that sellers maintain their dominance in the market, and the bearish momentum is likely to continue.
Doji
A Doji is a Japanese candlestick pattern that forms when open and close values are similar. It represents indecision in the market, where neither the buyers nor the sellers have control. The price can move above or below this line, but will eventually close at or near its value in either direction. These scenarios may be seen as indecision points where buyers and sellers have equal prices. The shape and orientation of the Doji can provide insights into potential future market movements. Although Interpretation of Dojis varies depending on context; however, it's important not just to look at them literally. But since cryptocurrency prices can be volatile, you don't see many exact Dojis anymore - so most cryptocurrency traders refer to this as “spin-top”. The presence of a Doji after a strong trend might indicate a potential reversal, but it's crucial to wait for further confirmation.
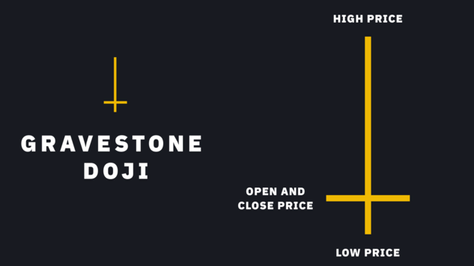
Gravestone Doji is a bearish reversal Japanese candlestick with a long upper wick and a close/open near its low. This pattern suggests that buyers were able to push the price up significantly, but by the end, sellers took control and brought the price back down to its opening level. It's a sign of potential bearish reversal, especially if spotted after an uptrend.
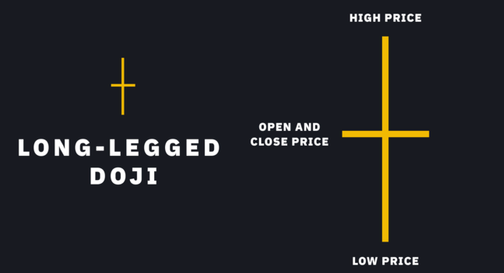
Long-legged Doji shows indecision in the market. It is a candle with both lower and upper long wicks, with its close/open at the midpoint. This pattern indicates that both bulls and bears were active, but neither could gain the upper hand. It's a sign that the market is unsure of its next direction.
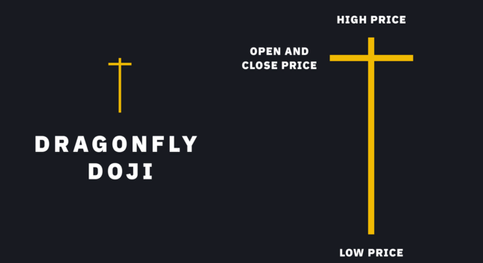
Dragonfly Doji can either take the form of a bearish or bullish pattern (depending on context). It has a long lower wick with its close/open near the high. This indicates that sellers were able to push the price down, but by the end, buyers took control and pushed the price back up to its opening level. If this pattern appears after a downtrend, it can be a bullish reversal signal.
Trade Like a Pro with Candlestick Patterns
The cryptocurrency market is a complex and volatile beast, and trading is an exciting way to make money. However, without the right tools and strategies, it can also lead to significant losses. One of the most important things for traders to understand is how price action develops; what drives prices up or down? Who's buying and who's selling? Candlestick patterns help us visualize these forces at work. They offer a snapshot of the market sentiment during a specific trading period, allowing traders to make more informed decisions.
While they don't necessarily predict where prices will go next, they provide valuable insights into why certain trends develop — which may allow you to anticipate future market movements better when deciding when best to buy or sell. For instance, a series of bullish candlestick patterns during a downtrend might suggest a potential trend reversal, offering a buying opportunity. If you want to get started with Bitcoin but don't know much about it yet, at Redot, we have an excellent Guide and a beginner's friendly trading platform to help you get started! Remember, while candlestick patterns provide valuable insights, they should be used in conjunction with other technical analysis tools and strategies for the best results.
*This communication is intended as strictly informational, and nothing herein constitutes an offer or a recommendation to buy, sell, or retain any specific product, security or investment, or to utilise or refrain from utilising any particular service. The use of the products and services referred to herein may be subject to certain limitations in specific jurisdictions. This communication does not constitute and shall under no circumstances be deemed to constitute investment advice. This communication is not intended to constitute a public offering of securities within the meaning of any applicable legislation.


