What Is Inverted Cup & Handle Chart Pattern?
There are many technical indicators that are used by traders to estimate the price direction of an asset. Some indicators are based upon the price patterns. The cup and handle is the prime example of such patterns. Although the pattern was originally used in the stock and Forex markets, it later came to be used in the cryptocurrency market.
The Cup and Handle pattern occurs when a pronounced, rounded bottom resembling a cup is formed on the price chart. The handle of the cup has a small decline. The cup is made up of smaller candles and usually has lower volatility than the handle. On the other hand, the handle is made up of larger candles and is often more volatile. The standard interpretation of the Cup and Handle is the bullish trend continuation.
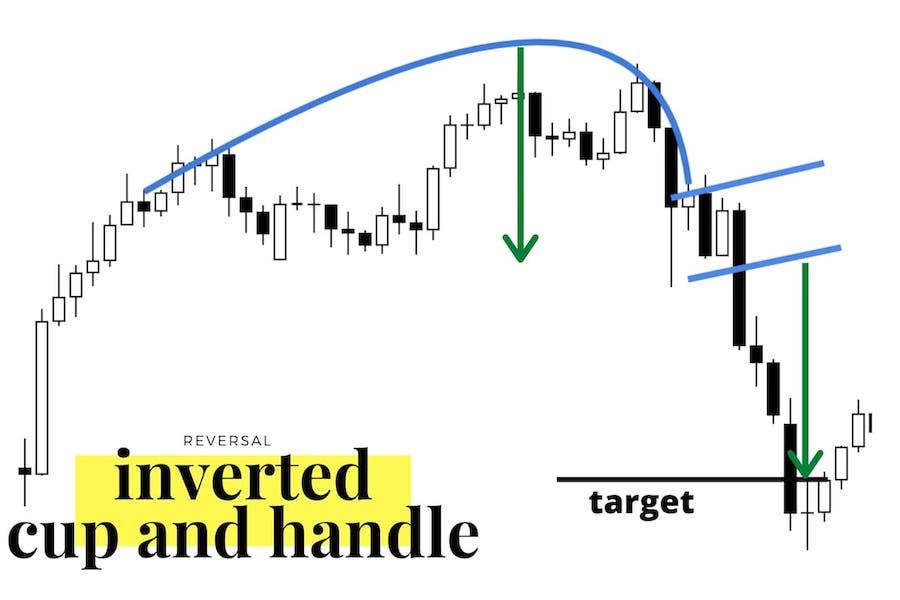
The Inverted Cup and Handle is a variation of this pattern. It has the shape of a cup upside down with its bottom at the top. Unlike the original cup, the inverted cup has a handle going upward.
Indicators in Inverted Cup and Handle Pattern
An inverted cup with a handle signifies the continuation of a bearish trend. It is formed in a downtrend, when the market continues to show new lower-lows and lower-highs. The formation of the figure starts with the asset price increase. Then the price returns to the position where the growth started. After that, there is a small correction upwards, after which the chart goes down again. The typical duration of the cup is from 1 to 6 months (based on the daily chart).

Cup
The main part of the pattern, the cup, is formed after a significant low is reached at the end of a downtrend.
There are two basic cup shapes:
- Ω-shaped cup: as the correction occurs on the market, a curve is formed gradually;
- Ʌ-shaped cup: prices change aggressively and fall quickly, forming a sharp bottom.
The more rounded the cup’s shape, the stronger the signal. The largest volume spikes should be observed at the top pattern and its final breakout.
The bottom of the cup, since it is on the top of the reverse cup and handle chart, forms a resistance level. In the case of a perfect cup, its edges will be at the same level, although such cases are rare.
Handle
The cup’s “handle” is the second part of the upside down cup and handle pattern and is formed after the cup. It is a price rollback, which can take various forms: rectangular, flagon-shaped, descending groove, etc. The handle is formed when the price reaches the support level and a small correction takes place. As soon as the handle’s formation is completedk, the crypto price falls even lower. In this case, the less deep the handle is, the higher the chances of a powerful break-down.
Continuation Pattern vs Reversal Pattern
Typically, price chart patterns are divided into reversal and continuation ones. While the first type indicates a change in the direction of the price, the second one signals that the existing trend is likely to continue. At the same time, traders acknowledge that no pattern can be entirely reliable. Continuation patterns, for instance, may show a sudden reversal.
For example, the Inverted Saucer is a reversal pattern. It resembles the Inverted Cup and Handle, but has no handle. It indicates that the price of the asset has reached the maximum and the uptrend has come to an end.

By contrast, the Inverted Cup and Handle is a continuation pattern. It is used to catch the continuation of a downtrend.
List of Things to Note in the Cup and Handle Pattern
The cup and handle pattern has many nuances which require a trader’s attention, such as:
- The pattern works best when there is a pronounced bearish trend;
- The formation of the whole upside down cup and handle shape may take several months, that is why it is advisable to trace it on a daily time frame. The handle is formed from one to 4 weeks;
- The handle should not exceed 50% of the cup depth. Ideally it should be less than 30%. If it exceeds 50%, the pattern is considered unreliable and should not be traded;
- Trading volume plays a big role in completing a pattern and confirming a breakout;
- After a correction comes an impulsive drop in price, which breaks the level of resistance. Such price declines can occur after the release of macroeconomic news which impact the fundamental analysis;
- Remember that patterns may break. Look at the bigger picture to make sure you haven't missed any signs of the pattern breakdown.
Examples of Inverted Cup and Handle Pattern
As you can see in the chart below, we have an Inverted Cup and Handle pattern forming on ENJ/USDT for about 2 weeks since early February.

The horizontal line connecting the edges of the cup is the key support line on this pattern.
The breakout was confirmed when prices broke through this level. In this example, the point of the breakout was $1.705 and the price target is the same as the depth of the cup.
Here is another example of the pattern. The chart below shows the Inverted Cup and Handle forming on NEAR/USDT during a month from mid-March through the first half of May.

The key support trend line in this example is at $10.5. The breakout was confirmed when prices broke through that level, accompanied by high trading volume. The price target was approximately the depth of the cup.
How to Trade the Inverted Cup and Handle Pattern
Before you start trading, remember there is no chart pattern that works 100% of the time! Also, make sure to place a stop loss order a little above the top of the handle. The stop loss level should depend on your risk tolerance.

If you are trading the Inverted Cup and Handle, you should open a short position. Before placing an order, it is imperative to wait for the full formation of the pattern. That is, the support line must be broken, forming a handle, and the price candle must close below that level. Thus, the target level, where the price moves after the formation of the pattern, should be approximately equal to the height of the cup-shaped part of the formation.
1 - Riding With The Trend
One of the most popular strategies is the use of a moving average. It is an indicator that smooths price movements and shows the average value of a cryptocurrency over a certain period of time.
Combined with the inverted cup pattern with a handle, this indicator can help you quickly determine the current trend and the best entry points into a position. It is best to use the 20-period exponential moving average (EMA-20), which acts as a dynamic support and resistance level.

In the example above, we consider opening a short position as soon as the price closes below the EMA 20. The candlestick formations can be used to determine an entry point. You want to see a shooting star or an inverted hammer shape right below the EMA line.
We can hold the position until there is a pullback to the edge of the cup to the support line. That way, we make a quick profit and immediately close some or all of the position. If you have partially closed the position, the rest of it can be closed after the support level is broken and the price goes down to the level about the size of the cup’s depth.
2 - Looking for Stochastic Divergence
Another indicator that goes well with the cup and handle pattern is the stochastic oscillator (SO), which is a momentum indicator. It uses two moving averages to compare the current price to previous prices. The stochastic indicates the overbought and oversold state of the market and shows how strong the current trend is and how soon a reversal may occur.
It is most effective to look for a divergence between SO and price action. Such divergence occurs when prices and the oscillator move in the opposite directions.

This chart shows that stochastic divergence occurs when price bounces and reaches the maximum of the pattern handle. Thus, this signal indicates that a strong downtrend is approaching, which gives us an opportunity to enter a short position.
3 - Volume is Your Best Friend!
Another important indicator is trading volume. Volume is probably the most useful indicator in technical analysis. It reveals valuable information about supply and demand and gives you a clear signal about the strength of the trend.

When combined with the cup and handle pattern, volume can be used to identify a support line breakout, as such breakouts typically occur on high volume. Therefore, while trading the Cup and Handle, be sure to pay attention to the selling volume during the decline. A surge in selling volume indicates that traders are rushing to sell off their positions and the market is dominated by bears.
Conclusion
The Inverted Cup and Handle provides traders a sell signal during a downtrend. The pattern has distinctive features such as length, proportions, entries, stops and targets. However, keep in mind that the cup and handle pattern does not work all the time. Statistically, the accuracy of the formation of this pattern is about 65% if traded on a daily time frame.
Therefore, it is advisable to use this pattern along with other technical indicators to correctly identify the entry and exit points and increase the chances of a successful trade.
FAQ
How Do You Recognize an Inverted Cup and Handle Pattern?
The pattern can be recognized by its distinctive shape, which is fully consistent with the pattern’s name. There are cup walls and a relatively flat bottom, with an upward line resembling the cup’s handle. This does not mean that the shape will be perfect, but it is usually close to that.
When Should We Sell in Case of an Inverted Cup and Handle Pattern?
The standard strategy for opening a short trade is to open a position at the moment of breakdown of the support line after the cup handle is formed. However, it is worth considering the possibility of a false breakdown. To protect yourself from such a scenario, wait for the price to retest the support line.
Can We Buy an Inverted Cup and Handle Pattern Within the Trading Range?
No, the inverted cup and handle usually indicates a bearish trend. Therefore, traders use the pattern to identify the entry points for selling or shorting the asset.
Why Do We Need Stop-Loss in an Inverted Cup and Handle Chart Pattern?
The stop loss set just above the maximum of the handle protects traders from excess losses. The losses can occur if the pattern breaks.
*This communication is intended as strictly informational, and nothing herein constitutes an offer or a recommendation to buy, sell, or retain any specific product, security or investment, or to utilise or refrain from utilising any particular service. The use of the products and services referred to herein may be subject to certain limitations in specific jurisdictions. This communication does not constitute and shall under no circumstances be deemed to constitute investment advice. This communication is not intended to constitute a public offering of securities within the meaning of any applicable legislation.


